They will be presented monthly alongside the usual Mean Kilometres Between Failure (MKBF) metric.
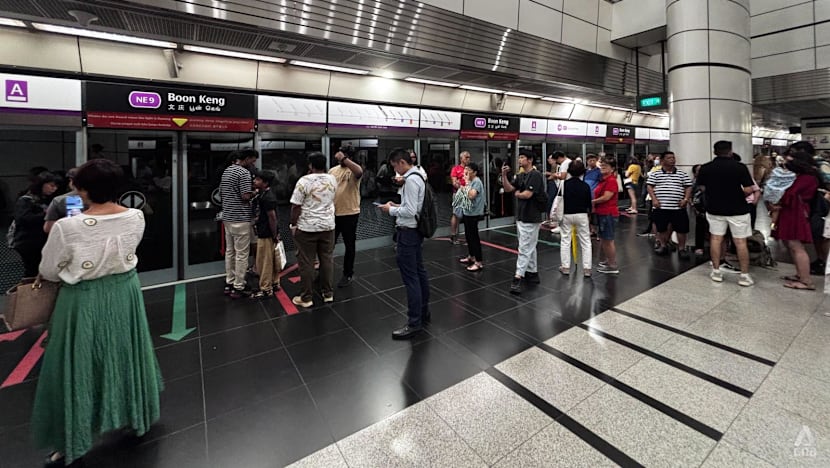
Commuters at Boon Keng MRT station on Aug 12, 2025. (Photo: CNA/See Kit Tang)
New: You can now listen to articles.

This audio is generated by an AI tool.
SINGAPORE: Three additional rail reliability indicators will be published to give commuters a “fuller picture” of Singapore’s rail network performance, the Land Transport Authority (LTA) announced on Friday (Nov 14).
These indicators have been tracked by LTA, but not made public until Friday. They were presented along with the authority’s rail reliability report, which is now being released monthly instead of the previous quarterly basis.
Among the additional indicators published, Train Service Delivery measures the actual distance travelled by trains compared to the scheduled distance, while another metric, Train Punctuality, measures the extent to which train trips are completed on time.
A third metric measures an estimate of the number and proportion of commuters affected by severe disruptions exceeding 30 minutes.
These come on top of the usual Mean Kilometres Between Failure (MKBF) metric, which measures the average distance trains travel before encountering a delay-causing fault. Since 2016, rail reliability has been tracked through MKBF, as well as the number of service delays exceeding 30 minutes.
Unlike the MKBF, which has a target of 1 million train-km for the MRT network, the newly published indicators were not presented with a benchmark or target.
Public scrutiny has intensified after a string of rail disruptions earlier this year.
In September, it was announced that a rail reliability task force comprising the Land Transport Authority (LTA) and train operators SMRT and SBS Transit will be formed to address service disruptions.
Later that month, Acting Minister for Transport Jeffrey Siow said in parliament that although new indicators can be “fairly technical”, he had asked LTA to share them publicly.
“We will be transparent, because we have a good system, and we have nothing to hide,” he said then.
TRAIN SERVICE DELIVERY
Train Service Delivery measures the actual distance travelled by trains compared to their scheduled distance, expressed as a percentage.
This means that the higher the Train Service Delivery, the higher rail reliability, as it means that more train trips operated according to schedule.
While MKBF captures the kilometres between failures, Train Service Delivery captures the extent of the service disruption. For instance, longer disruptions will reduce the mileage that trains travel on schedule, hence lowering the figure.
Between 2020 to 2023, train service delivery figures ranged between 99.71 per cent and 99.99 per cent across five lines: The North-South Line (NSL), East-West Line (EWL), North East Line (NEL), Circle Line (CCL) and Downtown Line (DTL).
However, for the whole of 2024, the Train Service Delivery of the EWL fell to 99.42 per cent. The other lines were at 99.80 per cent or higher.
That year saw the massive six-day EWL disruption that affected about 500,000 train journeys.
Latest figures for Train Service delivery for the month of September show that the DTL has the highest percentage at 99.94 per cent, and the CCL has the lowest at 99.60 per cent.
August’s figures show that the NEL’s Train Service Delivery had dipped to 99.07 per cent. That month, no train services were available on a large stretch of the NEL for three hours due to a power fault.
Across the entire network in September, the Train Service Delivery figure is 99.83 per cent. This is lower than the latest figures for the metros in Chinese cities (99.99 per cent) and Hong Kong MTR (99.9 per cent), and higher than that of other systems such as the Paris Metro (99.35 per cent), Melbourne Metro (99.2 per cent), New York City Subway (95.5 per cent) and Berlin U-Bahn (93.15 per cent).
The Thomson-East Coast Line (TEL) has been excluded from the new metrics, as it is still undergoing construction and extension and “will take time to stabilise”, said LTA.
LTA said it will review whether to include the data points for the TEL in subsequent publications, "based on whether these other indicators are reflective of the performance of the line".
TRAIN PUNCTUALITY
Train Punctuality measures the percentage of train trips that complete their trips “on time” at the end of each line or a scheduled turnaround point plus or minus two minutes within schedule.
Train Punctuality is affected by service disruptions, as well as other operational problems that do not result in a full stoppage of service, such as slower travel speeds due to minor signalling or track faults, said LTA.
Therefore, a higher Train Punctuality rate means that more trips arrive within a specified time window, and this means the metro is more reliable.
From 2020 to 2024, Train Punctuality on Singapore’s MRT lines ranged between 98.85 per cent and 99.93 per cent. Between 2021 and 2024, NEL has the lowest punctuality score among the five lines.
LTA said that figures for the NEL are typically lower than for the longer lines, as it is the shortest line in the train network.
“It is more challenging to maintain Train Punctuality on shorter lines, as operators have less time to adjust travel speeds or dwell times to ‘catch up’ if the train meets with a delay,” said LTA.
The same pattern can be observed in the monthly figures. NEL had the lowest percentage for Train Punctuality in August and September, at 96.98 per cent and 97.81 per cent respectively. CCL had the highest percentage in August (99.71 per cent), while DTL had the highest percentage in September (99.78 per cent).
Overall, Singapore’s MRT had a 99.16 per cent Train Punctuality rate in September. This is lower compared to latest figures from the metros in Chinese cities (99.99 per cent), the Seoul Metro (99.99 per cent), Hong Kong MTR (99.9 per cent) and Taipei Metro (99.41 per cent).
The MRT’s Train Punctuality rate is higher than the Tokyo Metro (99 per cent), Berlin U-Bahn (98.88 per cent), Melbourne Metro (94.5 per cent), London Underground (91.6 per cent) and the New York City Subway (85 per cent).
PASSENGER IMPACT
For severe disruptions lasting more than 30 minutes, LTA also provided additional estimates of the number of passengers affected, both in absolute terms and as a proportion of daily ridership for the affected line.
This is because the severity of a disruption can be measured not only by its length, but the number and proportion of passengers affected, said LTA.
For example, for the three-hour long NEL disruption in August, over 50,000 passengers were impacted, comprising 9.7 per cent of daily passengers along the line.
During a CCL disruption in March, between 5,000 and 50,000 passengers were affected, comprising 1.4 per cent of daily passengers.
NEW FIGURES DIRECTLY ADDRESS COMMUTER IMPACT: ANALYST
Welcoming the latest move, Associate Professor Raymond Ong, a transport infrastructure researcher at the National University of Singapore (NUS), said that the existing MKBF indicator “doesn’t tell the commuter too much info”.
While the indicator tells the commuter how long normal operations lasted between failures, it does not give an indication of the severity of each disruption.
Agreeing, Associate Professor Walter Theseira, a transport economist from the Singapore University of Social Sciences, said that the existing MKBF indicator does not distinguish how many people are impacted by the disruptions.
"If a train breaks down with hardly any commuters on board, did it really happen? It didn't affect many people, so people will not notice," he said.
"On the other hand, a breakdown at 8.30am at Punggol will affect thousands of commuters."
In this way, there could be a good MKBF, but the commuter experience could still be bad if the failures happened at the "worst times", he added.
Assoc Prof Ong said the new figures “directly address” the potential commuter impact, such as in gauging the percentage of train services delivered, whether they were punctual, and the number of commuters affected in severe disruptions.
“It is a very generic understanding, but it allows the passenger to relate,” he said.
Asked whether the figures, being closely bunched between 96 and 100 per cent for Singapore’s MRT line, would not have much meaning to the commuter, Assoc Prof Ong said that it cannot be forgotten that trains are "supposed to be travelling at 100 per cent”.
He said that the comparison has to be made with other countries’ metro lines for it to be meaningful. He noted that several Asian cities have figures higher than Singapore’s.
He added that while Singapore has managed to keep up healthy figures alongside its Asian counterparts, older metro lines like those in New York and London are seeing lower percentages in the low 90s and even 80s.
These figures show how issues such as ageing infrastructure and a lack of manpower, for instance, can cause the figure to dip.
“Do not take these numbers (in Singapore) for granted,” he said.
As to whether it would be meaningful for LTA to set a target for the new figures, as it has done for the MKBF, Assoc Prof Ong said that it is more important to understand the factors that can cause the different indicators to fluctuate.
Fluctuations could be due to “inherent factors”, such as the maintenance and operating systems of the trains, and how public transport operators react and recover when there is a disruption.
“Understanding the cause is more important than putting a target or minimum percentage then trying to achieve it,” he said.
LATEST MKBF FIGURES
LTA also released the latest monthly MKBF figures on Friday.
The latest mean distance in kilometres travelled between delays of more than five minutes for the overall MRT network fell to 1.671 million in September, from 1.74 million in August.
Across individual lines, the NSL saw the largest monthly dip in MKBF, from 1.648 million in August to 1.236 million in September.
The largest improvement was to the CCL, which saw its MKBF go up from 1.245 million in August to 1.489 million in September.
The figures for the newer TEL were displayed on a separate table. Its MKBF had fallen from 311,000 in August to 287,000 in September.
LTA said that new lines such as the TEL “will take time to stabilise”.
For instance, teething issues can arise during initial operations as a result of system updates and can result in delays, even though the nature of such delays is different from those encountered during the operation of mature lines.
“We expect the performance of the TEL to improve after it fully opens in 2026 and its operations have stabilised, such that its fault trends can be fairly compared with our other mature lines,” said LTA.


